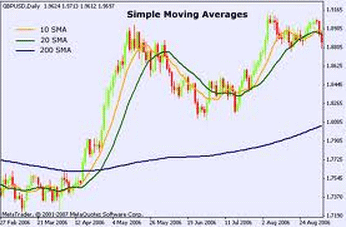
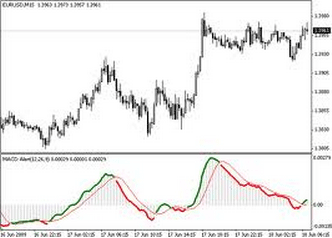
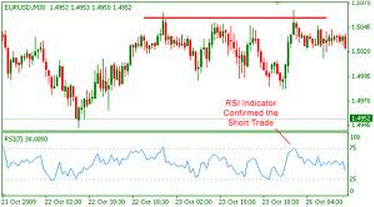
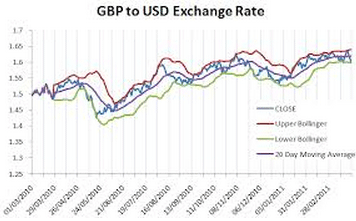
Because indicators are wide-ranging and diverse, we categorize different indicators according to how itís used in technical analysis. Below are the different types of indicators: Momentum Indicators  momentum indicators help determine the direction of a trend. There are many ways to profit from the marketís movement, one way is to follow the trend and exploit it for maximum profit. Thus, momentum indicators serve as a guide to help traders determine whether they should enter in a long or short position. One of the most common momentum indicators is the moving averages. Moving averages simply represent the average closing price in variable number of days. Thus, we have such things like 20-day, 50-day, and 200-day moving averages. Most Forex traders use combinations of these moving averages to identify the strength of the trend. For example, some traders use a combination of 50-day/200-day moving averages. It is a widely-held belief that if a 50-day moving average is above a 200-day moving average, the trend is a very favorable one. Another example is the use of 10-day/30-day moving averages combination. If these two moving averages cross over, it indicates a good entry points for momentum traders. Momentum-Confirming Indicators  If a momentum indicator helps determine the direction of the trend, a momentum-confirming indicator helps gauge if the momentum indicator is reliable or not. These indicators are most often used to complement a momentum indicator and may be used to generate a buy or sell signal. The two most common momentum confirming indicators are the moving average convergence divergence (MACD) and rate of change (ROC) indicator. An MACD simply shows the relationship of two moving averages. If the MACD is above the signal line, it indicates an upward trend; while if it fall below the signal line, it indicates a downtrend. However, if the MACD diverges away from the signal line, itís a good indication that the trend is likely over. The ROC, likewise, measures the price change between the recent price and the price N days previously. An ROC value of greater than zero indicates an uptrend; while an ROC value of less than zero indicates a downtrend. Overbought/Oversold Indicator  Sometimes, a trend can be a result of tradersí enthusiasm and unreasonable expectations. In which case, the trend will most likely not be sustained since the asset is overbought or oversold at that price level. And itís most likely the level when the excitement will wear off and the price will revert back to its mean since nothing substantial justifies the drastic movement. For cases like this, you need to have an overbought/oversold indicator to help you determine if the trend is a real one or a pullback is underway. Relative strength index (RSI) is used specifically for this purpose. This indicator takes into account the sum of up days and down days over a specified time period and calculates a value, which can range from 0 to 100. A value of more than 70 indicates that the asset is overbought; a value of 30 indicates that the asset may be oversold; and zero indicates neutrality. Profit-Taking Indicator  This indicator will help the trader decide if it is the right time to cash in on the profits. After all, paper profits mean nothing; itís actually when the trader closed the position when real profit is locked in. For this purpose, RSI can also be used. For example, you may want to sell your long position if the RSI is approaching 70-80 value since it indicates a very overbought asset and reversion may be well on its way. Another profit-taking indicator commonly used by many seasoned Forex traders is the Bollinger Band. This indicator features 2 bands that plot standard deviation of a moving average. Like the RSI, it can be used to indicate if the asset is overbought or oversold. If the price moves closer to the upper band, you might want to sell if youíre on a long position since this indicates that the asset may be overbought. On the other hand, if the price moves closer to the lower band, itís an indication that the asset is oversold. Successful Forex traders are well-versed on reading and interpreting different indicators. Thus, they never have to rely on just one indicator to base their trading decisions. Forex market is intricate and complex; thus, itís just fitting that traders immerse themselves in price variations inherent in Forex market. Itís just fortunate that there are many indicators that can aid us in determining such variations. comments powered by Disqus |

|
|
|
|


