How do you know if a company is a good company? That famous analyst and that famous trader usually tell us to see the balance sheet, income statement, and also cash flow statement. But hey, after skimming through all of them, we start throwing tantrum because we are stuck to the ratios, ratios, ratios and end up not taking decision at all. If you look carefully to the ratios and everything, you might realize most of the ratio derived from taking earnings, asset, and liabilities into calculation. In this article, we want to discuss if earnings growth should be used as trading criterion, in the process we will use 3 companies and that is McDonald (MCD) Coca Cola (KO), and Gold Corps (GG). In the table below you can see the earnings, earnings growth, also Stock prices and stock growth annually. 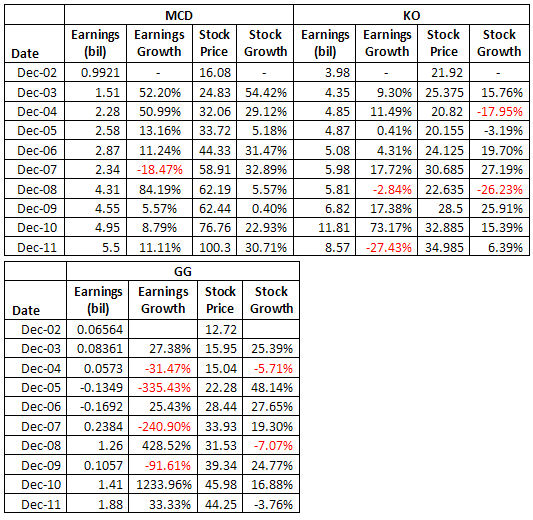 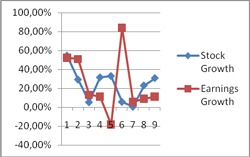 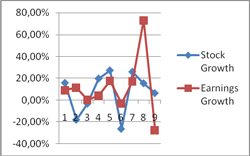 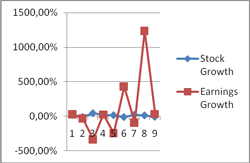 Chart of Earnings and stock growth for MCD (top left), KO (top right), GG (Bottom left) Looking at the chart, we can see at MCD chart earnings and stock growth moving in harmony until year 5 (2007) where the earnings growth was moving down, but stock price was not moving really much and then at year 6 (2008) the earnings growth was moving up drastically but stock growth was moving down sharply. This tell us that earnings growth sometimes can go in line with stock growth but sometime it can move in opposite direction. If we look again to the KO and GG chart, it is hard to see the pattern, but for KO it seems stock growth movement mirror the earnings growth movement, as for GG I would better look at the table where I can see big inconsistencies where the earnings growth movement goes up and down ignoring the stock growth movement. Based on this graphic, I’m sure it is not enough to get any conclusion. To get clearer picture, I have prepared another way to analyze if the earnings growth is in line with the stock growth. Here is the table that shows total earnings growth and stock growth over 10 years. 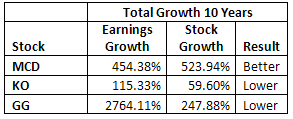 When I look to this table, I can say, everyone who bought MCD at 2002 and kept it until last year can be happy because the earnings growth actually was lower than the increase in stock price. Looking at KO the case is still acceptable although earnings growth at 115.33% the stock only grow at 59.60%, but after taking glance at GG, I’d say this company is surely undervalued. The earnings growth is 2764.11% but the stock growth is only 247.88% or one tenth of its real growth. Our conclusion is that earnings growth cannot be used as standalone trading criterion after looking at the wide variable of result in MCD, KO and GG. I’d say you would need to combine it with another filter such as revenue growth, sales growth, debt growth, short term liabilities, and long term liabilities. After making analysis using the entire filter, of course there is no guarantee your trades are going to be successful but making the analysis can help you get to know how each company perform.
|

|
|
|
|