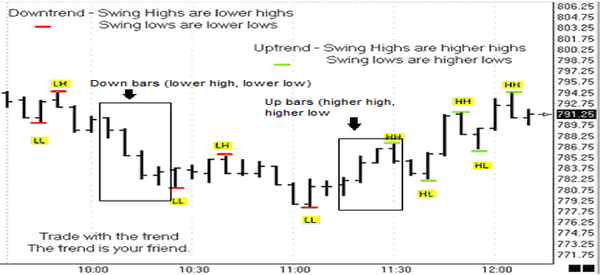
Trading, at its very basic, is all about buying and selling assets for a profit – albeit, not necessarily in that order. Though the definition is very rudimentary, it’s best to keep in mind that trading basics when talking about price action trading. What Exactly is Price Action Trading? Ask this question to different traders and you’d probably get varied answers. You’d probably hear simple answers like: “high highs and high lows indicate bullish trend; swing highs and testing top/bottom are essential part of price action.” Or you may hear vague answers like: “Price action is the analysis of charts in an effort to find some order in seemingly random patterns.” While both answers describes price action in different ways, disjointed answers like these would just make aspiring traders think that they’re kept in the dark when it comes to price action trading or they may dismiss this type of trading as something not worth their time to get into. Price action simply refers to the fluctuation of an asset’s price. Traders analyze candlestick and price bar patterns and use it to speculate the asset’s price next movement. Because no two traders will analyze a pattern the same way, the concept of price action trading is just as elusive as its definition. However, just as trading can mean different strategies for different traders yet is fundamentally about a very basic concept, there are price action basics that aspiring traders need to understand. Understanding Price Action Basics Price action traders look at charts devoid of most indicators – a “naked” chart, as some would like to say and looks for bar patterns that would indicate the short-term trend or direction of price movement. Common bar patterns include:  Up Bar – indicates that there are more buyers than sellers. Bars of this type have higher highs and higher lows than the preceding bars. In price action, the asset is in an uptrend until the last bar shows a closing price that’s lower than the open. The reversal is often confirmed with succeeding bars that shows lower highs and lower lows. Down Bar – indicates that there are more sellers than buyers. Bars of this type have lower lows and lower highs than the preceding bars. The asset’s price is in a downtrend until the last bar shows a closing price that’s higher than the open. The last bar indicates that a reversal could well be underway with more buyers than sellers on that last bar. The end of the trend is confirmed when the next bar shows a higher high and higher low than the last down bar. Outside Bar – an outside bar engulfs its preceding bar. It has higher high and lower low than the previous bar. If the open and close of an outside bar is more or less on the same price level, it indicates that the market is undecided and could go either way since neither buyers nor sellers are in control. If the open is distinctly higher than the close, it means that sellers are more in control; and therefore indicating a bearish market. However, if the open is distinctly lower than the close, buyers are getting the upper hand, which indicates a bullish market. Inside Bar – an inside bar has a lower high and higher low than the previous bar. This usually indicates market indecision since neither buyers nor sellers are in control. However, if the open is distinctly lower than the close, this may indicate a slightly bullish market since buyers are getting in control. If the open is distinctly higher than the close however, this may indicate a slightly bearish market. It is important to keep in mind that there are only 3 ways a market could move: up, down, or sideways. Thus, in price action, an uptrend is determined if: • The chart shows series of up bars (higher highs and higher lows). • The swing high or the peak price of an asset has higher highs and the swing lows or the trough price of an asset has higher lows A downtrend is determined if: • The chart shows a series of down bars (lower lows and lower highs). • The swing highs are lower highs and the swing low are lower lows. And the market is considered moving sideways if it’s not making a movement in either direction or no pattern of a trend discussed above is observed. This may all sound a statement of the obvious but these concepts are fundamental in price action trading. Mastery of these concepts will help the trader analyze which way the market is going and time his trades so he’s better positioned should market move in the speculated direction.
|

|
|
|
|