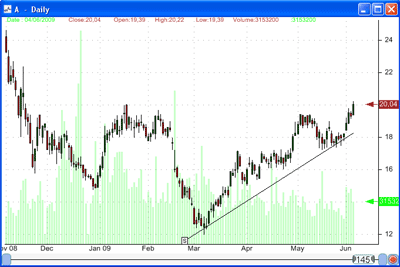
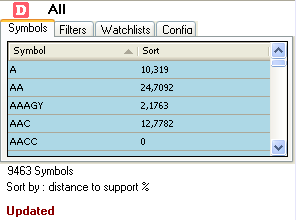
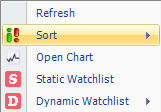
This tutorial explains how we can use the watch-list plug-in to keep track of our support and resistance drawings. The idea is to let the watch-list plug-in informs you when your favorite symbols are approaching or crossing theirs supports or resistances. You just have to draw these lines and the software will take care of the rest. To start this tutorial, select some symbols and draw some supports and resistances. (use the resistance/support line -R/S-)  Once you have done that, open the watch-list plug-in (Tools->Watch-list), select the watch-list tab, then create a dynamic watch-list. In this watch-list, include all symbols and use the default formula. Once the watch-list created and selected, right click on the symbols grid, select 'Sort' then choose between the following four values. Distance to support: distance between last close quote and the support Y-value at the last bar. Distance to resistance: distance between last close quote and the resistance Y-value at the last bar. Distance to support %: distance between last close quote and the support Y-value at the last bar (in percentage). Distance to resistance %: distance between last close quote and the resistance Y-value at the last bar (in percentage).
Here is how the internal work is done: the plug-in calls the support or resistance drawing and ask it for the Y-value at the last bar, once it gets a response, it calculates the difference between this value and last close quote and displays it. Note that when you download new quotes or update the drawing support or resistance, the watch-list automatically updates the distance values. It takes generally less than few seconds. Why few seconds? Why not instantly? it's because the application needs to wait some time so that if there are several updates in a short period of time, they could be grouped before the application send them to the plug-ins (instead of sending them separately, which take more calculation time. It is just an internal optimization). Now select a symbol in the watch-list window and draw or update its resistance or support line, wait a few seconds and see how the value updates. You can sort theses values to have a quick look at which symbols are the nearest to theirs supports or resistances.  Add this watch-list to Bookmark bar so you can use it later whenever you want to catch potential trades. To do so, in the watch-list tab, select your watch-list then drag and drop it to the bookmark panel.
|

|
|
|
|


