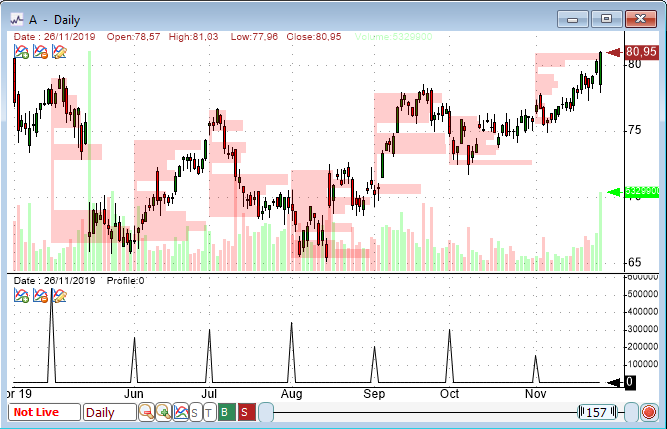
The following is a presentation of the new features that were implemented in the most recent version of QuantShare, the quantitative analysis tool. Please let us know in the comments section below, which features do you want us to implement and if you have any questions about the newly added features. Bookmark Tool This tool allows you to create shortcuts for your favorite chart's position. To open the bookmark tool, select "Tools" then "Bookmarks". Let us say, you entered a trade on AAPLE on Jan 2019. To save this position as a bookmark, right click on the entry date on the chart and select "Add to Bookmarks". As you soon as you hit that button, a new entry will be added in the "Bookmarks" control. Now, whenever you click on that entry in the Bookmarks control, the selected chart will load with the corresponding bookmark symbol, time frame and the chart will automatically move the bookmark date. You can specify whether to display the bookmark date on the right or left of the chart by clicking on the "Settings" button at the bottom of the "Bookmarks" control. Finally, you can organize your bookmarks by categories by simply adding new categories then dragging and dropping any bookmark into that category. GetMarketProfileData Function The new GetMarketProfileData function is an advanced C# new function that allows you to access profile data within your C# custom functions created using the "Tools -> Create Functions" tool. Let us go through an example: We have the following profile function in our chart (QS language): PlotProfile("volume", month() != ref(month(), 1), 1, 10, colorRed, colorRed, OperationAvg); This will plot the average volume profile each month. Now, let us use our new "GetMarketProfileData" formula to get the average volume of the first bucket and display it on a chart. We first need to use the "GetMarketProfileData" to calculate the profile, similar to what we have done with the QS language. This function returns a variable of "VectorProfile" type. This is the first line of the below C# code. After that, we just need to loop through each bar, check when the profile data is not null (that would be the first of each month in this case). Finally, we can access the first bucket value using the "BucketsY" property. VectorProfile vp = cFunctions.GetMarketProfileData("volume", TA.Month() != TA.Ref(TA.Month(), 1), 1, 10, ProfileDataCalculation.Avg); for(int i=0;i < vp.Length;i++) { if(vp[i] != null) { result[i] = vp[i].BucketsY[0]; } }  Quarterly Time Frame In this new version of QuantShare, you can now use quarterly as a time frame in your chart, backtests, composites and screeners. To do this, simply select "Quarterly" in the time frame control. In the composite tool for example, create a new composite, click on "Next" twice to move to the third screen. Click on "Daily" next to "Select a time frame" then select "Quarterly". Median Composite Function The composite function is one of the most powerful function in QuantShare. It allows you to calculate market indicator and rank securities very easily using a single line of code. The following QS language formula, for example, calculates the average daily return for all securities in your database: a = comp(perf(close, 1), "avg"); And here is how to use the new 'Median' function to calculate the median daily return for all securities in your database. a = comp(perf(close, 1), "med"); More information about the composite function: How to create market indicators using the composite function - Part 1 How to create market indicators using the composite function - Part 2 How to create market indicators using the composite function - Part 3 Trading Indicators using the Rank and Percentile functions New Ranking and Percentile Composite Functions New Data Feed for the Indian Markets With this new release, we have added support to a new real time data provider (https://globaldatafeeds.in/) that provides streaming data for Indian markets. In order to connect to Global datafeed, select "Accounts -> Connect" then "Global Datafeeds". In the new form, enter your ApiKey (that is provided by Global Datafeeds) then click on "Close". To learn more about real time features, please check the following links: Presentation of QuantShare's new Real Time Version Real-Time Quote Sheets with QuantShare Note that the data feed is available only in the premium version of QuantShare. Please send us an email if you want to upgrade from the advanced to the premium version.
|

|
|
|
|


