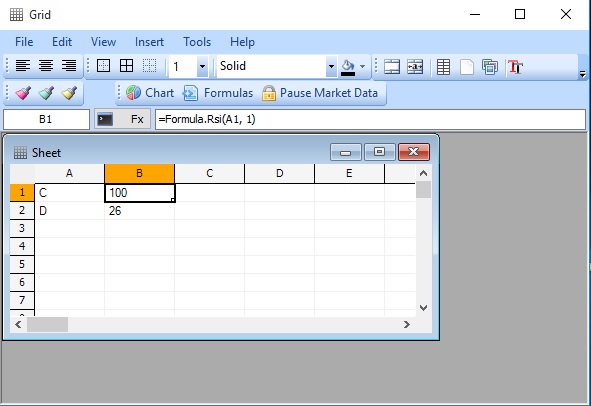
In a previous post, we have introduced the grid tool and how you can use it to create real time sheets. Today, we are going to show you how to use QuantShare functions and indicators and apply them to particular cells. We are going to show you how to create and calculate in real time the relative strength index of a particular stock. - Select "Tools -> Grid -> Grid Editor". - Select the first cell "A1" then type a ticker symbol. Example: GOOG - Click on the second cell "B1" then in the above tool bar, click on the "Formulas" button A new control will open where you can add QuantShare language as well as C# formulas. For this example, we will need to create a QS language formula, so let us click on the "Add formula" button at the top. Let us name that function by typing a name next to the "Name" field. Call this function "rsi". Below that field, click on the combo box next to "Data Used" and select "Realtime" as we want to calculate the real time value of the relative strength index. In the formula editor on the right, type the following formula: cell = Rsi(2); This simple formula will calculate the 2-bar relative strength index then return the result to the cell. Please note that you can add indicators by clicking on the "Add Indicator" button and you can also display the available functions/methods by using CONTROL+SPACE hotkey. By default, each QS formula in the Grid tool has two parameters by default which are the ticker symbol name and the time frame. You can add additional parameters by click on the "Add Variable/Parameter" button. Later, we can access that formula within a particular cell by calling this function: =Formula.rsi("GOOG", 60) This will execute the "rsi" function we just created while passing "GOOG" as ticker symbol and 60 (1-minute) as time frame. Click on the "Compile" button at the top then close the form. - Select the second cell again "B1" then type in the above formula editor (next to "Fx" button) =Formula.rsi(A1, 60)  Note how we replaced "GOOG" by A1. This means that the function will use the value that is returned by the A1 cell as first parameter. If you change the ticker symbol in A1, the formula in B1 will be automatically updated. The final step would be now to select a data feed for our cells. Select both cells, right click then select "Data Feed" then your data feed. To save this grid, click on "File" then "Save". You can open that grid directly in QuantShare by selecting "Tools -> Grid -> Open Grid" in the QuantShare menu then selecting the grid you just saved.
|

|
|
|
|


