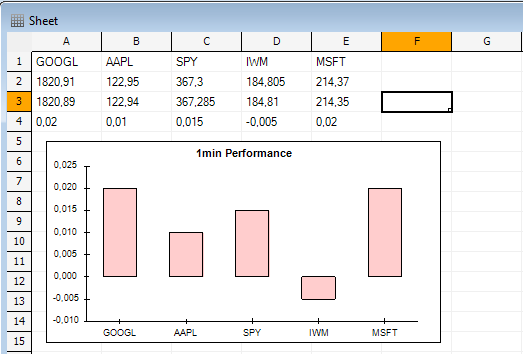
The Grid tool is one of the tools that are available with the Premium version. The reason for that is that the Premium version supports real-time data and the grid tool was mainly created to display and work with real-time data using one or several data feeds. Let us show you today how to create graphs using the grid tool. Select "Tools -> Grid" then "Grid Editor" Select "File -> New" in the Grid editor then type in the number of rows and columns. Example: 30 as the number of rows, 10 as the number of columns Add Formulas Type "GOOGL" in A1 cell Click on A2 cell then click on the "Fx" button at the top under the tool bar. Let us select a function now. We want to display the real time data of GOOGL, so we select "Intraday" then "GetClose". Type A1 as "Symbol Name". QuantShare will get the symbol name from the "A1" cell. Changing the value of "A1" will automatically update any function that references that cell. Set 60 as "Time Frame". This will display the last price of the last 60 second -1min- bar. Same as the last tick which has a time frame of 0. If you do not see any data then make sure that you are connected to a data provider such as "IEX Exchange", "Interactive Brokers", "Yahoo Feed"... Also, you need to make sure that your cells are using the correct data provider. For this, select all cells then right click, select "DataFeed" then select the data provider you want to work with. Click on A3 cell then enter the following formula directly next to the "Fx" button at the top. Note that you can use the formula editor but we want to show you here how to quickly add a formula to a particular cell. =GetOpen(A1, 60) // This will display the open price of the last 1min bar Note that by default there is no backfill so you will need to wait here 1min in order to get the correct open price. Click on A4 cell then enter the following formula: =Round(A2-A3, 3) // This will display the difference between the close and open value of the last 1min bar Copy Cells Select the first four cells (A1, A2, A3 and A4) then click on the right/bottom corner and move your mouse to the right to copy the cell, just like you would do with Excel. In the first row, update the "GOOGL" text and type in other stock or ETF ticker symbols. Create Chart Select "Insert -> Chart" then select "Vertical bar" as type of chart Right click on the chart, select "Chart Settings" then update the chart's title. Example: "1min Performance" Right click on the chart, click on "Select Cells", select the cells in the fourth row (Example: A4:E4) then click "OK" on the new "Select Cells" control. Right click on the chart, click on "Select X-Axis Cells", select the cells in the first row (Example: A1:E1) then click "OK" on the new "Select Cells" control. Your chart is ready now. You can move it, edit it and watch it update in real time. 
|

|
|
|
|


