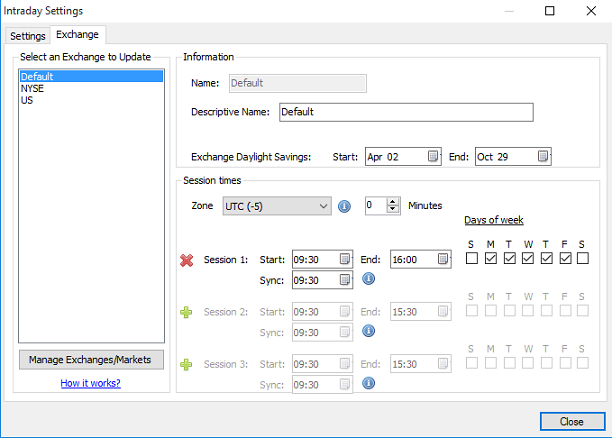
Depending on whether you want to adjust time for real time data or historical intraday data, the procedure is totally different. The historical data is downloaded from a specific source and the data is stored with the source time. If you are downloading intraday data from Yahoo, Google or any other data provider, the only way to change the bar's time is to edit the downloader and update the pre or post-script. Let me show you an example: - If you don't have the "Intraday Data for US Stocks" downloader then please download it from here: Intraday Data for US Stocks - Select "Download -> Download Manager" then select "Intraday Data for US Stocks" - Click on "Update" at the top of the download manager - Click on "Parser" button in the first row then on "OK" and "Next" - Click on "Next" again to see the bars date/time Now, let us suppose we want to increase the time by two hours. - Back the "CSV Settings" page (click on "Back"), click on "Post Script" button then add the following script: for(int i=0;i < Data.Rows.Length;i++) { Data.Rows[i].Date = Data.Rows[i].Date.AddHours(2); } - Click on "OK" then "Next". The time is not updated on this screen (because at that moment, post script is not executed yet) - Click on "Next" again then on "Show Output". In real time mode, the time is also specified by the data source but can be changed on fly using exchange settings. First, at the bottom of the chart, click on "Not live" at the bottom/left corner (in case the chart is not in live mode) then select a data feed (premium version only). Click on the circle at the bottom/right corner then on "Exchange Settings".  If no exchange is specified for your ticker symbol, then "Default" exchange will be selected. You can check your symbol Market/Exchange by selecting "Symbol -> Update Symbol". If that Market/Exchange is not available in the list, then you will need to add it here "Symbol -> Categories". In the "Exchange" tab, you can define the exchange daylight saving, the time zone, the session time start and the sync time (which is usually the same as the time start). The sync time is the time that is used as a reference to build bars. For example: If you are displaying an hourly chart and the sync time is 9:30 then the bars will have the following timestamps: ...8:30, 9:30, 10:30... If the sync time is 9:00 then the bars will have the following timestamps: ...8:00, 9:00, 10:00... In order to change the bars' time, you will need to modify the "Zone" field. Set it to the appropriate value then click on "Close".
|

|
|
|
|


