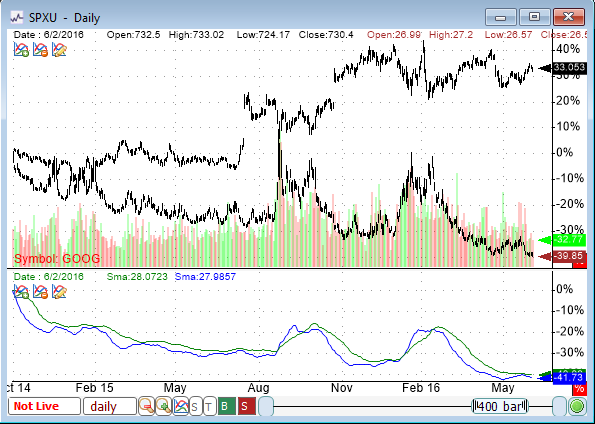
In the last release, we have introduced a new scaling option that would change the vertical axis display from price to percentage. The percentage displayed on the chart would be the price changes compared to the first visible bar. Enable the percentage scale You can choose to either enable the percentage scale for all panes or for each individual pane in a chart. To enable the percentage scale for all charts, click on the chart icon at the bottom of the chart (next to zoom in/out) then select "Set Percentage Scale". You will notice a new "%" icon at the bottom/right corner of each pane. Also notice how the Y-axis values has changed to percentage values A value of 40% indicates that the time-series (or open price for candlestick) has increased 40% since the first visible bar to the selected one. To enable the percentage scale for each pane separately, right click on a pane, select "Tools" then "Set Percentage Scale". If the "Set Percentage Scale" option is not visible this means that the pane is already in percentage scale mode. Comparing two assets It is often interesting and important to compare two assets. With this new QuantShare feature, you can easily see how each asset has increased/decreased and easily compare one asset with another. Click on the "Add Indicator" button in the main pane (top/left corner of the pane) then select the "External Symbol" tab. Type a ticker symbol, make sure "Compare with current symbol" is checked then click on "OK".  Comparing several time-series You can perform the previous process to add more symbols and compare multiple assets. You can also compare different time-series such as moving averages, close series and any other indicators. As an example, create a new pane by right clicking on the main pane then selecting "Create new pane". Now, click on the "Add Indicator" button in the newly created pane (top/left corner of the pane) and select "All Indicators". In the "Search" input box, type "sma" then add a simple moving average. Perform the same steps and add a new simple moving average with a different period. Please note that the two moving average doesn't start at the same level and thus we cannot compare them as it is. Right click on this pane then select "Edit Formula". The left/right icons in the tool bar of the formula editor allows you to switch between the different formulas. For each "Sma" formula, replace the plot style from "StyleSymbolNone" to "StyleOwnScale" then click on the "Update Graph". Moving averages can now be compared as they both start at the same level.
|

|
|
|
|


