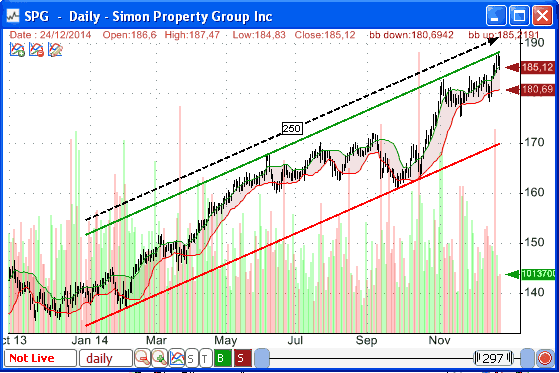
Support and resistance levels are not supposed to be impenetrable barriers offering a risk free buy at the support threshold and sell at the resistance threshold. Traders and investors should see these resistance/support as psychological levels, concentration of supply and demand and places on the chart where a reversal may occur for the underlying security. In this article we will show you how to create a watchlist that would scan for parallel resistance and support lines. First, let us create a dynamic watchlist. - Select "Tools -> Watchlist" - Click on "Create" in the Watchlist form - Click on "Create a dynamic watchlist" - Select the securities to include in the watchlist then click on "Next" - Type the following formula then click on "Finish" to save your watchlist p = 250; s = autosr(0, 0, p); r = autosr(1, 0, p); d = absolute(s - r) / absolute(s[p] - r[p]); filter = d < 1.1 and d > 0.9 and close > 5;  Let us know go through the formula and explain how it works. The first line creates a new variable "p" and associates it with the 250 value. This would be the period to use to find our support and resistance. You can update this value later if you want to find other short, medium or longer-term supports and resistances. The second line uses the "autosr" function to automatically calculate the 250-bar support. The third line uses the "autosr" function to automatically calculate the 250-bar resistance. The "autosr" function is a unique QuantShare indicator that calculates automatic supports and resistances based on the data prices. You can use the auto-support and resistance as a drawing tool by selecting the "Auto Support/Resistance" icon in the drawing tools list (on the right bar). You can learn more about this function by reading the following blog posts: Detect chart patterns using the auto support/resistance indicator Backtesting chart patterns using the auto support and resistance indicator Once the last support and resistance are calculated, we measure the ratio of the support/resistance spread/distance on the last date to the first date (250 bars ago). This is done in the fourth line of the above formula. The actual filtering/scanning occurs in the fifth line. The "filter" variable must be higher than 0 in order for the watchlist to include a specific security. In the filter rule we check for the previously calculated ratio to be between 0.9 and 1.1. This would allow us to scan for stocks with almost parallel resistance and support lines. In addition to the above rules, we have also added a price rule that would prevent us from displaying securities with a price below $5. You can find a ready to use watchlist to scan for parallel resistance and support lines here: Parallel Resistance and Support Lines Note: In some rare cases, when you use the Auto Support/Resistance drawing tool and add it to the past 250 bars, you may find out that the lines are not parallel. This is because the drawing tool has an additional setting that allows you to specify the number of bars to skip around the high/low (Right click on one of the lines, select "Settings" then "Trendlines" tab). If that value is say 4, then the algorithm would ignore the four bars next to the high/low and would not use these bars as a second point to build the support or the resistance.
|

|
|
|
|


