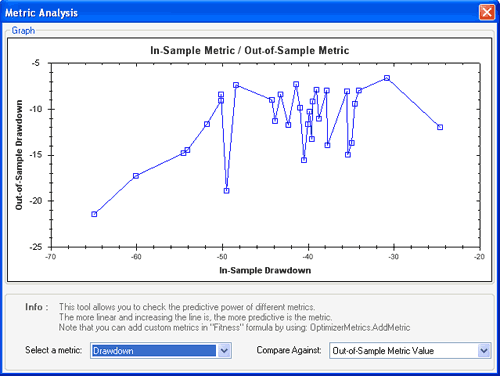
Yesterday, we have released a new version of QuantShare. Version 3.3.1 comes with several updates, bug fixes and new features. Major new features are presented in this article. Multiple Metrics in the AI Optimizer Report If you have used the AI optimizer tool, you already know how important and powerful this tool for optimizing your list of rules, ranking system, neural networks or trading systems. Now, you have the ability to add additional measures and metrics to the AI optimizer report. These metrics would not be used to rank the different systems but rather to help you get a better view of the systems picked and analyzed by the PBIL or Genetic algorithms. You will also be able to see each metric's value for the in-sample and out-of-sample tests (Check the "Metric Analysis" paragraph below). In order to add new metrics to the report, use the "OptimizeMetrics.AddMetric" function in the Fitness script editor. Here is an example that adds 4 metrics (Sortino ratio, annual return, maximum drawdown and weekly return besides the Sharpe ratio which is used here as a fitness function) Fitness = SharpeRatio; OptimizerMetrics.AddMetric("Sortino", SortinoRatio); OptimizerMetrics.AddMetric("AnnualReturn", AnnualReturn); OptimizerMetrics.AddMetric("Drawdown", MaximumSystemDrawdownInpercentage); OptimizerMetrics.AddMetric("WeeklyReturn", AverageWeeklyReturn); Note: The fitness function is the main measure and it is used to rank the different trading systems used by artificial algorithms. More info regarding the AI optimizer tool can be found here: How to Optimize a Trading System with Thousands of Billions of Combinations Metric Analysis - Open the AI optimizer tool (AI -> Optimizer) - Select an item or create a new one - Add different metrics as explained above - Run the optimizer - Click on "Report" button to get the optimization report - Perform an out-of-sample test (make sure you select different symbols or start/end dates) - Once the In/Out of sample testing done, click on "Metric Analysis" button at the top/right panel to analyze the predictive power of different metrics. The "Metric Analysis" tool will display: - The gain (difference between in-sample and out-of-sample fitness) for each In-Sample metric value - The out-of-sample metric value for each in-sample metric value The more linear and increasing the line is the more predictive the metric should be.  Regime Analysis The "Regimes" tool allows you to check your strategy under different regimes. It can be found in the trading system report that is displayed after you backtest or optimize a trading system. - Select "Regimes" tab in the trading system report - Click on "Calculate" - Select a market regime from the list below How it works: Each market regime has its own formula. QuantShare simply uses this formula to check whether the regime is valid or not. If it is valid then it buys the current strategy equity curve. If it is not then the equity curve is sold. This gives us approximate results of what a strategy would have performed under that particular regime. Select a regime to display the formula associated with that regime in a tooltip. Example: - Short-Term Bullish Market Your strategy will enter new positions only if the market is in a short-term bullish regime as specified by this formula: close > sma(50) Translation: S&P 500 is higher than its 50-bar moving average Note that some market regimes requires that you have some indices added to your account (Example: ^GSPC (Yahoo symbol for S&P 500) and ^VIX (Yahoo symbol for the volatility index) More regimes will be added in future releases. You will also be able to create and add custom regimes. Get next day's orders from global script In case, you generate and backtest trading systems using the Global script (Tools -> Script Editor), it is often useful to get next day's orders from a trading system backtesting report. These next orders are equivalent to orders generated by a portfolio when the "Get Signals" button is hit. Here is a script example of how to get next day's orders: string tradingSystemName = "My Trading System"; SimulatorTask st = Simulator.Backtest(tradingSystemName, true); while(!st.IsCompleted) { App.Main.Sleep(500); } QOrder[] orders = st.Reports[0].GetOpenOrders(); New features/updates can be found here.
|

|
|
|
|


