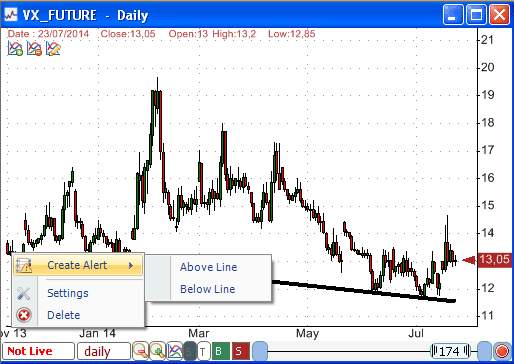
Say, you draw a resistance line and want to track when stock prices increase 5% above that line. You can use the Alerts tool (Available in the real time version) or create your own formula and use it in screener, watchlist... This can be accomplished using a unique QuantShare function that allows you to reference drawing studies from QS formulas. Using the Alerts Tool - Open a chart - Select the "Line" drawing tool - Draw a trendline - Right click on that line and select "Create Alert -> Below Line" This will create an alert for the analyzed security. The alert will be triggered when the close price crosses below the study's line.  How to use the "DrawItem" Function In the previously created alert, notice that the formula used as condition looks like this: close > DrawItem('166967', 'Line') The "DrawItem" function allows you to reference a hand-drawn study in QS programming language. That function accepts two arguments: Argument1: Study Name/ID Argument2: Study Element Type The study name can be found next to the "Name" field when you right click on a drawing item then click on "Settings". You can of course update the "Name" value and set it to any value you want. The study element type is the study part that should be referenced by the formula. As an example, if you use the trendline, you will have only one type "Line". If you use the Fibonacci Extension, you will have several types (Line 0%, Line 38.2%, Line 50%, Line 61.8%...). You can reference any one of these lines. The easiest way to know the different element types available is by typing the formula then using CONTROL+SPACE shortcut. Type: DrawItem('166967', [WHEN THE MOUSE CURSOR IS HERE, USE CONTROL+SPACE] Where "166967" is the study name. Note that you can also reference other type of drawing items including ellipses and rectangles. You can for example detect whether the last security price is within a hand-drawn ellipse or not. Example: - Draw a trendline then detect when the security crosses above this trendline by typing: a = cross(close, DrawItem(' - Draw Fibonacci Extension on chart then detect when the security drops below the 127.2% level by typing: a = close < DrawItem(' - Detect whether security prices are within a rectangle (you have drawn) a = DrawItem("522028", "Box", close); Note that rectangle and ellipse studies require an extra time-series parameters so that QuantShare knows which time series is inside or outside the rectangle or ellipse. Using the Screener, Watchlist and Backtester Tools Since all these tools use the QS programming language, you can use the above "DrawItem" function to reference and access hand-drawn studies data. If you want to analyze several stocks for, let us say, a support breakout then draw your support line in each stock's chart and have the same name for each of one of these stocks. Example: - Open GOOG chart, create a resistance and name it "Resistance100" - Open AAPL chart, create a resistance and name it "Resistance100" ... Open the screener tool, and then type the following formula to detect a resistance breakout: filter = close > DrawItem('Resistance100', 'Line'); If you want to detect a stock increasing 5% above that resistance line, type: filter = close > 1.05 * DrawItem('Resistance100', 'Line'); Custom Drawing Tools Besides built-in drawing tools, you can also reference custom drawing tools (Tools -> Custom Drawing Tools). Each time you create a line, rectangle, ellipse... in the script editor, you will have to define a name for it. You can use that name later to reference parts of your custom drawing tool. Example: Functions.PaneObject.DrawLine("My Line", 0, 0.7, 20, 0.65); // Here, the line's name is "My Line" Your custom drawing tool can create hundreds of lines; you will be able to reference each one of these lines very easily using QS programming language. For a beginner tutorial of the QS language, please read: QuantShare Programming Language Tutorial
|

|
|
|
|


