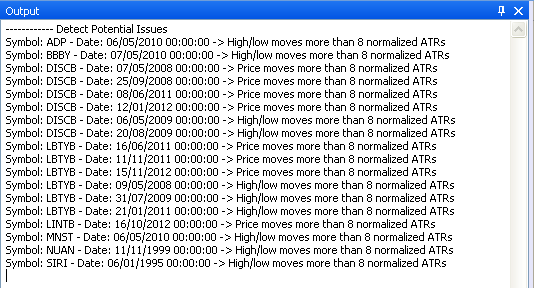
The script I am going to show in this post can be used detect potential data issues. It can be used to detect potential splits, bad ticks, issues in OHLC data... The script simply uses a list of pre-defined rules that will be applied to all your securities. An example of rule would be to detect moves and report any security that moved more than X normalized ATRs. Later, you can of course add your own rules to detect not only potential data issues but anything else you want. This post was suggested by our friend Dave and here are the different rules that will be used: - price moves of X normalized ATRs (potential split) - low price greater than high price or open price (or high less than low or open) - low / high price more than X normalized ATRs from the open And here is the equivalent of these rules in QuantShare programming language: rule = natr(1) > 8*natr(10); rule = low > high or low > open or low > close; rule = high < low or high < open or high < close; rule = ((high/low)-1)*100 > 8*natr(10); For more info about QS language, please read this blog post: QS Programming Language How to Create a Global Script In QuantShare, select "Tools -> Script Editor". In the script editor, select "File -> New" then type a name to create a new script. Scripts are C# or JScript.Net based. You can download the script here: Potential Issues/Errors Script Once added, you can add the script to the bookmark panel. When executed, the script will report all issues in the output window (View -> Output). You can then check the issue directly in a chart, fix it manually (Data -> Edit Databases) or download data again for the concerned securities. Example:  How to Update the Script? There are five variables you can update in this script: 1/ The first two lines define the time frame and whether you would like to analyze end-of-day or intraday data. Example: timeframe = 1; // 1 day (or 1-second if intraday data) isHistorical = true; // Analyze EOD data 2/ The variable "symbolsFilter" refers to a symbols filter. You can keep it empty to analyze all securities in your database or you can type a a symbols filter to analyze only specific securities. You can create a symbol's filter by selecting "Symbol -> Symbol's View". Right click on the control then click on "Create a new symbols filter". After that you can add one or several conditions to your symbols filter to returns only the securities that meet these conditions. 3/ Filter rule variable allows you to filter stocks on specific bars. For example, to consider only stocks whose price is higher than $1, simply type: string filterRule = "close > 1"; 4/ The variable "Rules" is a list that contains the different rules used by the script to detect potential data issues. You can add a new rule, simply typing: Rules.Add(new Rule("descriptive name", "formula in QS language"));
|

|
|
|
|


