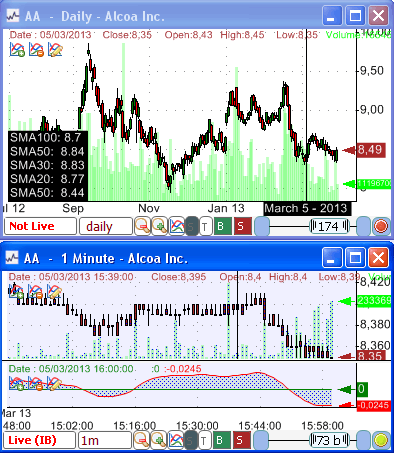
A very interesting blog post we have written few weeks ago shows how to associate a specific layout to a security or a group of securities. The idea is very interesting particularly if you are trading several assets at the same time. With this technique you can for example automatically display different indicators to each group of assets. More information about this script can be found here: Update chart layout based on active symbol Part 1 - Part 2 Today, we will do the same thing but instead of associating a layout to a security, we will associate a layout to a specific time frame. How to create a layout A layout contains all the required information to display a chart. It contains the number of panes, the template of each pane, the different formulas for each pane… To create a new layout from an existing chart, right click on the chart, select "Layout" then "Save Layout As". How the Script Works? The script basically loops indefinitely checking for a change in the time frame of the active chart. Once the time frame of a chart changes, it checks if there is a specific layout associated with the new time frame. If it founds one, it automatically updates the active chart with the new layout. You can download the script here For more information about how to install the script and add it to the bookmark panel (button installed on the main window), please read the "How to Install the Script" section here. Testing the Script: Update Layout based on the Time Frame In order to associate a layout to a time frame, you must open the script and update the C# code. Don't worry it is very easy. In the first line, you can specify the default layout to apply to any chart (white the script is running). Example: string defaultLayout = "Default"; In this example, the default layout name is "Default". In next lines, you can associate a time frame to a particular layout. Each time that time frame is selected on a chart; the corresponding layout is automatically loaded. Specify a positive time frame value to reference EOD periods and a negative time frame value to reference intraday periods. Examples: // Associates the daily time frame with the "DailyL" layout AddPeriod(1, "DailyL"); // Associates the one-hour time frame with the "Swing" layout AddPeriod(-3600, "Swing"); // Associates the tick time frame with the "BidAsk" layout AddPeriod(0, "BidAsk"); Note that the different layout names mentioned in the above examples are not built-in, they are just examples. 
|

|
|
|
|


