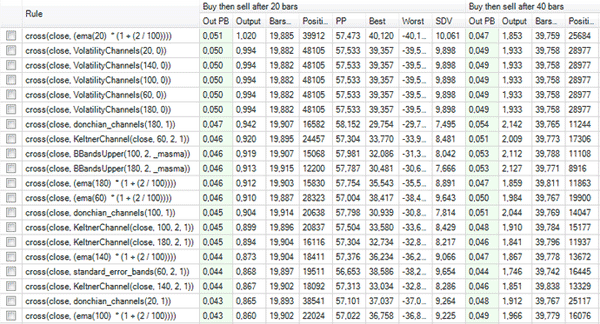
One of their major strength is their ability to use both price action and volatility. Price bands or channels are trading indicators composed of two lines. The upper line is a sort of resistance line (Area of abundant supply) while the lower line is a sort of support line (Area of strong demand). Over years, technical analysts have developed several price channel indicators; some of these include the Bollinger bands, Donchian channels, Keltner Channels, Volatility Channels, Standard Error Bands, Adaptive Price Channel and Moving Average Envelopes. Bollinger Bands Probably, Bollinger bands is the most popular one. Its middle line is simply a moving average. By calculating the standard deviation of past prices and adding/subtracting it to the middle line, we can build the upper/lower line of the Bollinger bands. Bollinger bands indicator is built-in QuantShare. Here is how to reference this indicator in QS language: Upper Line: BBandsUpper(20, 2, _masma) The above line creates the upper band by adding 2 standard deviations to the 20-bar simple moving average. Lower Line: BBandsLower(20, 2, _masma) Donchian Channels Donchian boundaries are based on high and low of previous N-Periods. The indicator can be downloaded here: Donchian Channels Upper Line: donchian_channels(20, 1) Lower Line: donchian_channels(20, -1) Keltner Channels Keltner boundaries are set around a moving average. It is based on the average true range or the high/low range. The indicator can be downloaded here: Keltner Channel Upper Line: KeltnerChannel(close, 20, 2, 1) Lower Line: KeltnerChannel(close, 20, 2, -1) Volatility Channels The volatility channels use the highest and lowest previous values to determine the upper and lower lines. The indicator can be downloaded here: Volatility Channels Indicator Upper Line: VolatilityChannels(20, 0) Lower Line: VolatilityChannels(20, 1) Standard Error Bands This price channel indicator is based on the alpha and beta coefficients of the linear regression of the past N-prices. The indicator can be downloaded here: Standard Error Bands It also requires the following functions: calcA and calcB. Upper Line: standard_error_bands(20, 2, 1) Lower Line: standard_error_bands(20, 2, -1) Adaptive Price Channel The adaptive price channel uses the highest high and lower low values of the price series over a non-fixed lookback period. The lookback period follows changes of the 30-bar standard deviation of the close series. The indicator can be downloaded here: Adaptive Price Channel Upper Line: Apc(40, 10, 1) Lower Line: Apc(40, 10, 0) Moving Average Envelopes It is based on 2 exponential moving averages. The distance between the upper and lower moving average is expressed in percentage. Upper Line: mult = 2; up = ema(20); up = up * (1 + (mult / 100)); Lower Line: mult = 2; down = ema(20); down = down * (1 - (mult / 100)); How to Trade with Price Channels There are several ways to trade price channels. The most used buy and short rules are: Enter long when the price breaks upper band (Uptrend with strong bullish pressure) Enter short when the price breaks lower band (Downtrend with bearish pressure) Of course there are other ways to trade price channels, but for now we will stick with the above rules. Comparing the Different Price Channel Indicators We are not going to compare the so-called advantages and disadvantages of each price channel indicator. We want numbers and that is why we are going to backtest each indicator against S&P 500 stocks to discover which one performs best. To conduct this test, we will create a list of rules then use the rules analyzer tool to assess the performance of each rule. - Select "Analysis" then "Rules Manager" - Click on "Create", type "Price Channel" then click on "OK" - Select "Price Channel" list of rule then add rules one by one in the right panel Example of rule: cross(close, donchian_channels(20, 1)) The above rule generates a signal when the price crosses above the upper line of the Donchian channel. You can download directly a ready-to-use list of rules here: Price Channel Trading Rules It contains a rule for each price channel indicator plus several variations of the lookback period. Quantitative Analysis Now that our list of rules is ready, let us do some quantitative analysis. We are not going to do a true-portfolio backtesting but instead we are going to analyze each rule and backtest it against S&P 500 stocks. The difference between true-portfolio and individual backtesting is that in the latter case the simulator engine will analyze every trade and it will not take into account portfolio's requirements and settings such as the number of positions, capital... - Select your list of rules then click on "Analyze the list" - In "Symbols & Period" section, select the start/end dates then select S&P 500 stocks (You can do that by adding an "Index" condition then selecting S+P 500) Note that if you do not see "S+P 500" then it is probably because your list of symbols is not associated with indices. To update your symbols, select "Symbol -> Auto Manage Symbols". Check the exchanges you are trading (Example: NASDAQ, Amex and NYSE), check "Force the update of symbol information" then finally click on "Save". - Back to the rules analyzer tool, click on "Outputs" tab after selecting the simulations dates and the S&P 500 stocks - In the "Outputs" tab you can select your exit rule (When you select multiple exit rules, you will get a report for each rule) - Click on "Continue" to start the backtesting/analysis process 
|

|
|
|
|


