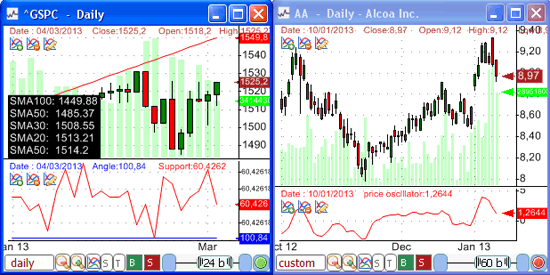
You probably do not trade stocks like your trade futures or Forex currencies. It is also unlikely that you use the same indicators and rules for all assets. If you agree with that then you will find the following article very interesting. This post describes a script that is implemented in QuantShare. This script will run on background and it will automatically update the chart layout based on the active symbol and a predefined list of symbols/layouts. If you are still wondering what I am talking about, here is an example: Let us say that when displaying stock charts, you often want to display the RSI indicator and two moving averages on the main pane. This is our default pane. When displaying Forex charts, you want to display the number of stock tweets per day as well the correlation with another currency. Our script will automatically choose the right layout for you when you select an asset. If you choose a stock then the first layout (RSI + Moving averages) is displayed and when you choose a currency such as the EURUSD, the second layout (Tweets + Correlation) is displayed. What is Layout? A chart layout is a file that contains information about how to display a chart. How many panes it contains? What are the different formulas of each pane? What is the template of each pane? What is the chart's period?... How to create a new layout: To save the current chart's layout, right click on the chart, select "Layout" then "Save Layout As". How to set a new layout to a chart: Right click on a chart, select "Layout" then select an existing layout from the list. How to set a default layout: Right click on a chart, select "Layout" then "Set current layout as default". This layout will be used for example when you open a new chart using "View -> New chart". How to Install the Script - To open the script editor, select "Tools" then "Script Editor". - Click on "File" then "New" to create a new script - Type the script name then click on "OK" - Paste the script (Click here to get the complete script) - Click on "Execute" to run the script It is preferable to add the script to the bookmark panel. This allows you to run it quickly from the main window. Here is how to accomplish this: - In the "Script Editor" - Select "Settings" then "Add current script to bookmark panel" You may also instruct QuantShare to run this script when QuantShare trading software starts by creating a task using the task manager (Tools -> Task Manager). How the Script Works? The script contains several functions, which will be described later. First, it loops indefinitely. In the loop, it gets the active chart and check if there is a layout associated with the chart's symbol. If it does not find any layout, it uses the default layout as specified in the variable "defaultLayout", which of course you can change anytime by updating the script. If it finds a layout, it checks if the current chart has a different layout and updates that chart with the layout associated with the active symbol (The symbol selected for the active chart). The different functions created by the script are: AddSymbol(string symbol, string layout) Associates a symbol with a specific layout. AddSymbol(string[] symbols, string layout) Associates a list of symbols with a specific layout. Instead of calling the first function several times, you can create a list of symbols and then associate all these symbols to a single layout. AddSymbol(Symbol[] symbols, string layout) Associates a list of symbols (represented by "Symbol" class) with a specific layout. GetLayoutFromSymbol(string symbol) Returns the layout that was associated with the provided symbol. Returns "NULL" if the symbol is not associated with any layout. RegisterChart(long id, string layout) Informs QuantShare that the chart with the specified ID is associated with the specific layout. This prevents the script from updating the chart if its layout is already the right one. IsUpdate(long id, string layout) Gets whether to update the chart or not (changing its layout).  Update Layout based on Watchlists Did you know that you could associate a watchlist to a layout? For example, let us say that you have a watchlist that displays stocks that have a PER (Price earnings ratio) higher than 15. You can create a layout that displays historical PER data as well as other fundamental and instructs the watchlist to use that layout anytime you choose a symbol from that watchlist. To associate a layout to a watchlist: - Right click on the watchlist - Select "Settings" - Type the "Layout" name - Click on "OK" Second Part
|

|
|
|
|


