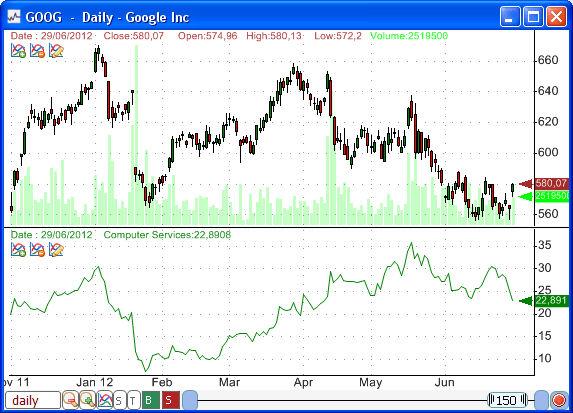
If you want to use a stock and its industry data on the same chart, strategy or composite, then keep reading. The technique I am presenting here will show you how to associate a stock with an industry index. After completing it, you will be able to display the performance of a stock and its industry on the same chart, calculate the relative strength of a stock compared to its industry, calculate the number of stocks that are outperforming their industries and so on. Downloading Industry Data Of course, the first thing you have to do is to download historical EOD data for the different U.S. industries. Fortunately, we already have such downloader in the sharing server. Industry Market Data item downloads historical quotes for more than 90 industries. Simply download the trading item and start it from the download manager to get the data. You will end up having +90 new ticker symbols, all starting with "^INDUSTRY_" keyword. For example: ^INDUSTRY_TELEPHONE SYS. ^INDUSTRY_TEXTILE MILL ^INDUSTRY_WASTE MGT. ^INDUSTRY_WATER COMPANIES How to associate a stock with the industry index Before implementing the function that will associate an industry with its corresponding ticker symbol, you have to make sure the industry field is filled for each of your stocks. You can do that manually but why bother when there is an automatic way to do so. - Select "Symbol -> Auto Manage Symbols" - Make sure you have US exchanges checked (New York Stock Exchange, NASDAQ and American Stock Exchange). You might also add "Over the counter" for OTC stocks. - Check "Force the update of symbol information" - Click on "Save" Within few seconds, symbols information of each of your stocks will be updated and you will have the industry name of each stock. Now, everything should be set up correctly. The indicator that will perform the association contains a hash table (sort of dictionary) that stores the industry names and their corresponding ticker symbols. When the indicator is called, it will perform the following actions: - Get current symbol name - Get industry name for that symbol - Check the table and extract the corresponding ticker symbol (From the symbols that were added by the previous downloader) This indicator can be downloaded here: Industry Index Name You can check its code by selecting "Tools -> Creation Function" then clicking on the indicator (IndustryIndex) in the left panel. Stock and industry data on the same chart Now, let us display a stock and its corresponding industry on the same chart. - Select "View -> New Chart" to open a new chart - Right click on the chart and select "Create new pane" In this pane, we are going to display industry graph - Right click on the new pane then select "Edit Formula" - Type the following formula: b = IndustryIndex(); a = "^INDUSTRY_".b; a = GetSeries(a, close, LastData); Plot(a, b, colorGreen, ChartLine, StyleSymbolNone); Interpretation: Line 1: Get industry name as defined by the industry data downloader (see above) Line 2: Create the industry ticker symbol Line 3: Get industry price series Line 4: Plot industry data - Click on "Update Graph" to save changes  There is another way to display the industry graph. It consists of creating another trading indicator (Example: IndustryEquity) and use something similar to the above code directly within the formula. Once the indicator is completed, you can display the same industry graph by typing: a = IndustryEquity(); Plot(a, industry(), colorGreen, ChartLine, StyleSymbolNone); The "IndustryEquity" indicator can be created using "Tools -> Create Functions" and its C# code would be: VectorS b = cFunctions.CompileFormula("b = IndustryIndex();").GetVectorString("b"); b = "^INDUSTRY_" + b; result = cFunctions.GetTimeframeData(b[0], cFunctions.Timeframe, "close").ToVectorD(); You can download this indicator from the sharing server here: Industry Equity. Once your chart is ready, you can save the layout for later use. Right click on the chart, Select "Layout" then "Save Layout As". Simple trading system based on relative strength The strategy we are going to develop will be called "Industry relative strength Trading System". It consists of buying the top 20 stocks that have the best relative strength compared to their industries. First, you should know that industry relative strength has nothing to do with the relative strength indicator (RSI). The term indicates the relative performance of a stock compared to the performance of its industry. The strategy formula is as follows: a = close; // Stock value b = GetSeries("^INDUSTRY_".IndustryIndex(), close, LastData); // Industry value a1 = perf(a, 25); // Performance of stock for the last month b1 = perf(b, 25); // Performance of industry for the last month ratio = (a1 - b1); // Industry Relative Strength which consist of the difference of stock return and industry return over the previous month buy = ratio > 0 and close > 5; // Buy only stocks that are outperforming their industry SetSimLongRank(ratio); // Rank stocks by their industry relative strength value To create this trading system: - Select "Analysis -> Simulator" - Click on "New" to create a new trading system - Select "20" in "Number of Position" (top) - At the bottom, set an N-Bar stop with "25" as value - Select "Create trading system using the formula editor" tab - Type the above strategy formula - Click on "Create Trading System" This trading system is already available in the sharing server. You can download it here: Industry Relative Strength. Any questions?
|

|
|
|
|


