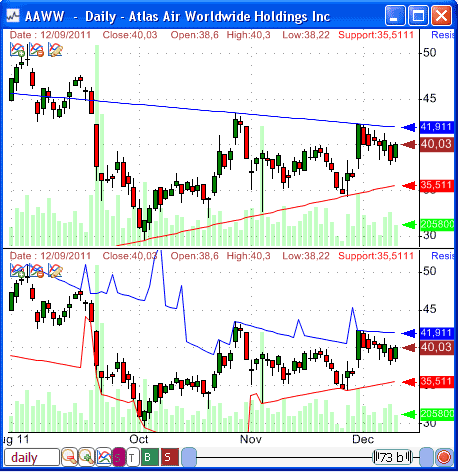
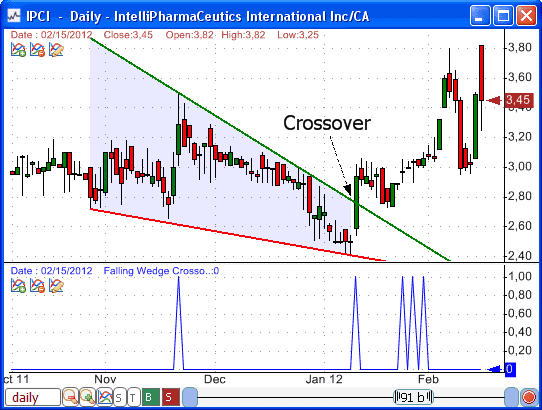
In a previous post, I have introduced the support/resistance indicator and gave some examples of how to use it to detect trading patterns such as the rising wedge, ascending triangle and symmetrical triangle. That post can be found here: Detect chart patterns using the auto support/resistance indicator In this one, I will show you how to use the same function to backtest simple and advanced chart patterns using QS trading software. Support and Resistance Lines The auto support and resistance indicator is called "AutoSR". It allows you to detect any kind of support and resistance lines (not just horizontal ones) of an asset given a lookback period. This function, as we have introduced in the previous post, returns the last support or resistance line. It can be used in a watchlist or when screening stocks but it simply cannot be used with the simulator or backtester tool. This is because the backtester requires that at any given trading bar, the function returns the support or resistance level at that bar. This means that these trendlines will be calculated based on that bar and the preceding N-bars (user-defined value). To see the difference between the basic and advanced use (for backtests) of this function, let us plot them: - Create a new chart with two panes - Right click on the first pane then select "Edit Formula" - Type the following formula then click on "Update Graph" PlotCandleStick("Quotes", colorBrown|255|colorViolet|255|0, StyleSymbolVdash); Plot(volume, "Volume", colorLime|55|colorLime|64|0, ChartBar, StyleOwnScale); period = 50; // The period used to calculate the trendlines res = AutoSR(1, 0, period); // Resistance level for each trading bar sup = AutoSR(0, 0, period); // Support level for each trading bar plot(res, "Resistance", colorBlue, ChartLine, StyleNoScale); plot(sup, "Support", colorRed, ChartLine, StyleNoScale); - Right click on the second pane then select "Edit Formula" - Type the following formula then click on "Update Graph" PlotCandleStick("Quotes", colorBrown|255|colorViolet|255|0, StyleSymbolVdash); Plot(volume, "Volume", colorLime|55|colorLime|64|0, ChartBar, StyleOwnScale); period = 50; // The period used to calculate the trendlines res = AutoSR(3, 0, period); // Resistance level for each trading bar sup = AutoSR(2, 0, period); // Support level for each trading bar plot(res, "Resistance", colorBlue, ChartLine, StyleNoScale); plot(sup, "Support", colorRed, ChartLine, StyleNoScale);  Why use the "lag" parameter? The second parameter of the "AutoSR" function allows us to specify a lag period for detecting support and resistance lines. If we want to detect trendline crossovers then specifying a lag of 1 (or higher) is necessary because otherwise the crossover would never occur (support/resistance levels are always above the high/low). A lag value of 1 means that we want to get support or resistance level one bar ago. In that case, the calculation will be based on [Current Bar - Lookback period, Current Bar], where the lookback period is specified in the third parameter. Depending on the analysis you want to perform, you can use low periods to perform short-term analysis or high periods to perform long-term analysis. Example: a = AutoSR(2, 1, 50); Backtesting Example: Stock Crossed Above its Resistance Line The first example will show you how to use the auto support/resistance function to scan for simple crossovers. To detect a stock crossing above its resistance line, simply type: filter = close > AutoSR(3, 1, 50); // This formula can be used in QuantShare screener To use the same formula in a trading system simply change "filter" by "buy". Once your trading system is created, you can easily backtest it and see whether this pattern is profitable or not. To backtest a resistance breakout with a high increase in volume: filter = close > AutoSR(3, 1, 50) and volume > 2*sma(volume, 10); Backtesting the Falling Wedge Chart Pattern In order to backtest the Falling Wedge trading pattern, we must calculate the slope of the resistance and support line, in addition to the levels. When using the basic "AutoSR" function to return the latest trendlines, we can calculate that slope using the "LinearReg_Slope" function. However, when performing backtests, we will not get the complete line (only levels) and therefore it is impossible, for example, to calculate the slope of the support line for each trading bar. Fortunately, there is a solution and it consists of creating a custom function and using the "TA.AutoSR" function. This function is almost the same as the one used in QuantShare programming language, with the difference that it is C# based and it contains other important measures (slope and intercept) besides the support or resistance level. Let us create a custom function that returns the slope of a support or resistance: - Select "Tools -> Create Functions" - Create a new function (Name: SlopeAutoSR) - Add three numeric parameters (type, lag and length) - Type the following code: VectorCustomDouble c = TA.AutoSR(type, lag, length); for(int i=0;i < c.Length;i++) { result[i] = c[i][1]; // Slope. c[i] is an array that contains three values: Level, Slope and Intercept. } Once created, you can use the new "SlopeAutoSR" function to calculate the slope of a resistance or support line for each trading bar. Note: You can also download this trading indicator directly from the sharing server: Slope of Support and Resistance Lines Example: a = SlopeAutoSR(3, 1, 50); Now, let us try to backtest the Falling wedge pattern. This bullish pattern appears when the range formed by the support and resistance lines is contracting (lower highs and lower lows). Our trading system will enter a new long position when the stock crosses above the resistance line. Here is a formula you can use in your trading system to backtest the wedge pattern crossover: period = 50; // The period used to calculate the trendlines res = AutoSR(3, 1, period); // Resistance level for each trading bar sup = AutoSR(2, 1, period); // Support level for each trading bar resSlope = SlopeAutoSR(3, 1, period); supSlope = SlopeAutoSR(2, 1, period); fwedge = resSlope < 0 and supSlope < 0 and supSlope > resSlope; // Detecting Falling Wedge pattern buy = fwedge and close > res; // The backtester will enter long if a crossover occurs The next picture plots a falling wedge pattern and the moment the price crosses above it. In the second pane, it shows the signals generated by the above formula. Each signal represents a crossover. 
|

|
|
|
|


