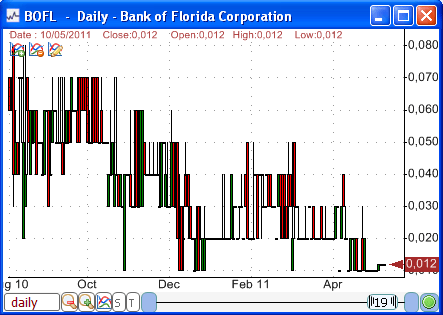
Scanning penny stocks should not be different that scanning other stocks. A penny stock is a stock trading at or below $5 (low priced security). There are however few things that you should know before creating a good screen for penny stocks using the QuantShare screener tool. Ticker Symbol of Penny Stocks In the US stock market, penny stocks are commonly traded on the OTC Bulletin Board and Pink Sheets. In order to add, the ticker symbol of OTC stocks in QuantShare trading software: - Select "Symbol" then "Auto-Manage Symbols" - Select the exchanges that interest you - Make sure you check "OTC Bulletin Board" and "Pink Sheets" - Check "Force the update of symbol information" - Click on "Save" then wait few seconds so that QuantShare retrieves the list of stocks that are listed on the exchanges you have selected - The new form that appears later shows you the number of stocks that will added, updated and removed from your database. Click on "List" to display the list of stocks and uncheck "Accept" if you want to ignore a particular action (Example: Removing symbols) - Click on "Accept" button to update your database (list of symbols) OTC Bulletin Board and Pink Sheets are two non-listed markets. The main difference between these markets is that in order to be quoted on the OTC BB, a company must be required to file reports with the SEC (U.S. Securities and Exchange Commission). Pink Sheet companies are not required to file reports with the SEC. Historical EOD data for Penny Stock The problem with the default QuantShare EOD downloader (as well as many other data providers) is that quotes are rounded up to two decimal places. In this case, some price information is lost and this missing information is particularly important when working with penny stocks. For example, the default downloader can report the following quotes for a particular penny stock: Date;Price 03/31/2011;0.01 04/01/2011;0.01 The stock looks like it has not changed while in reality that stock moved. A data provider that does not round up quotes will show you the following information: Date;Price 03/31/2011;0.0122 04/01/2011;0.0130 If you are penny stock trader or if you just want to practice penny stock screening, use the following end-of-day data downloader: US Historical Quotes from NASDAQ website. You can continue using the other downloader to get EOD data and use the new downloader to get data for penny stocks only: - Install the previous downloader - In QuantShare, select "Download" then "Download Manager" - Select "US Historical Quotes from NASDAQ" - Click on "Open Selected Downloader" - In "Symbols" tab, remove the existing condition then add a "Market" condition - Double click on the cell under "Values" and select "OTC" and "PINKSHEETS" - Click on "Start Downloading" Here is how to increase the maximum number of simultaneous threads: - Close the download item - Click on "Update" (top menu of the download manager) - Click on "Download Settings" - Update the "Maximum number of download threads to allow" field - Click on "OK" then "OK" again - Open the download item again then update the "Threads" field  Penny Stock Screener QuantShare screener will be used to scan penny stocks that are dropping and approaching the $1 level. This level is an important psychological barrier when trading penny stocks. - First, open the QuantShare screener by selecting "Analysis" then "Screener" - Click on "Create a new screen" - If you are in wizard mode, click on "Switch to editor" - Type the following formula: dis1 = close - 1; low1 = close == llv(close, 25); filter = dis1 >= 0 and dis1 < 0.02 and low1; Interpretation: - The first line calculates the distance between the share price and the $1 threshold. - The second line detects whether the share price is at a one-month (25 trading days) low. We did this by comparing the share price with the lowest price of the last 25 days (using the "llv" function). - The last line defines the filter or condition (screener rule). It returns a penny stock only if it is at a one-month low and trading near the $1 threshold. Here is an example of strategy using penny stocks identified with the previous screen: - Trade these stocks by placing a buy limit order at $1.02 and a stop order at $0.9 - If a stock increases, wait before selling it. You can for example sell it if it reaches $1.6 Please note that the above strategy is just an example and you should backtest it, adjust it and paper trade it before investing real money. It is important to notice that penny stocks are very volatile. They can provide very high returns but they carry much more risk that other basic stock investments.
|

|
|
|
|


