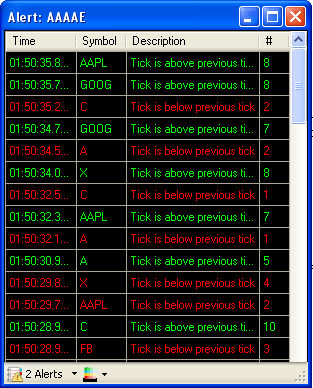
Let us say you want have a real time chart and you want to detect support or/and resistance breakouts. You can draw resistance and support lines on a chart using the "Line" drawing tool or you can use the "Auto Support/Resistance" tool to let QuantShare draw for you the perfect support and resistance lines. Breakout detection is very easy. All you have to do, is right click on a line, select "Create Alert" then choose "Above Upper Line" if you selected a resistance or "Below Lower Line" if you selected a support (This works only in the real time version). This will automatically create an alert for you filled with the chart symbol, time frame, data feed and the correct condition. The condition looks like this: close > DrawItem('144895', 'Upper Line') The "DrawItem" function is part of QS programming language and it returns the data of a drawing item. In this case the drawing item type is "Upper Line" and its name is "144895". You can update a drawing item name by right clicking on it, selecting "Settings" then updating the "Name" field. Note that the "DrawItem" function or the above condition can be used in any other QuantShare tool. As an example, you can plot this on a chart; use it in a screener, watchlist, automated trading strategy... Alert Notifications Back to the "Alert Settings" control; in "Notification" tab, you can select how you would like to be notified when the condition occurs. You have many choices there including a chart message, a sound playing, an email message or a script to execute. Alert Log The "Alert Log" tab let you define a custom log message and color to be used by the "Alert Log" tool (See "Log" button at the top of the "Alerts Manager" tool). Each time an alert is triggered, the trigger date, symbol and log message can be displayed in the "Log" tool. This tool is very interesting particularly if you associate many alerts with it or if you have an alert that is linked to several symbols. Click on "Add Alert" then type a name for your alert. Here is an example of an Alert Log window:  Alert Trigger You know when an alert is triggered when the icon next to the alert name turns green (of course you will also receive a notification if want to). If a stock breaks the support or resistance used by your alert then the alert icon will turn green. Note that you can still use that alert by moving the support or resistance line and this will automatically reset the alert. Same Alert for several securities Instead of creating an alert for each security you want to track. You can give the same name to all supports (support of each chart) and another name to all resistances. We already showed you previously how to change the name of a study or drawing item. After this, simply create an alert like we did at the beginning of this article, but this time, just update the "Symbols" field to include all securities or stocks you want to track. You can add several symbols by separating them with semi-colons or by clicking on the "Add Symbols" button and then using the symbols selection tool.
|

|
|
|
|


