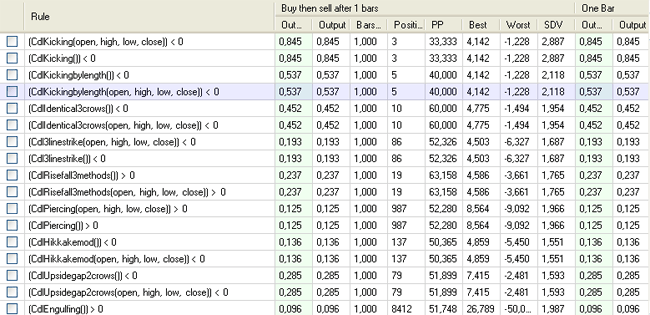
Do you know if the Doji, Hammer, Harami and other candlestick patterns are profitable or not? Stop guessing and start using QuantShare's rules analyzer and backtester tools. Creating Hundreds of Candlestick Rules - Select "Analysis" then "Rules Manager" - Click on "Create" to create a new list of rules - Call it "Patterns" then click on "OK" - Select "Patterns" list then click on "Mass rules" at the top - Click on "Add from TimesSeries Builder" - Check "Include CandleStick Patterns" and uncheck other items - Click on "Next" - Click on "Select All" at the button then on "Finish" - In the right panel (Masks), remove any existing mask - Type "mask > 0" then click on "Create" - Type "mask < 0" then click on "Create" "mask" variable will be replaced by candlestick rules. The first mask detects bullish candlesticks while the second one detects bearish candlesticks. - Click on "Create Rules" at the bottom You should now have about 244 rules Analyzing the Performance of Each Candlestick - Select "Patterns" list of rules - Click on "Analyze the list" - In the "Symbols & Period" tab, select the analysis start/end period and the symbols you want to backtest For example you can add an "Index" condition with "S+P 500" as value - Select "Output" tab then click on "Select Outputs/Exit Rules" - Uncheck any existing item, select "Performance, use N-Bars Stop" then check "Buy then sell after 1 bar" (Update the "Number of bars" field if necessary) - You can also backtest a short system at the same time, by clicking on "Add" then updating "Number of bars" to one and "Type" to "Short" - Click on "OK" - Click on "Continue" to start the analysis Now, each candlestick rule will be backtested using a simple logic: - Buy/Short when candlestick pattern is detected then exit the position after one bar - Entries and exists will be based on the open of the next bar The analyzer report will display the average output (average performance), number of positions taken, percent of positive positions... for each candlestick rule and for each output/exit rule.  How to Exit At the Close of the Entry Bar If you prefer to backtest rules by entering long the next bar at open and exiting the same bar at close then follow the next steps: - Select your list of rules then click on "Analyze the list" - Select "Outputs" tab then click on "Select Outputs/Exit Rules" - Select "Custom Output", click on "Add" then on "Edit" - Type "((CLOSE / OPEN) - 1) * 100" next to "SET" and "1" next to "WHERE" True Portfolio Backtesting The true portfolio backtester works differently from the rules analyzer tool. While the rules analyzer takes into account all positions and calculates metrics by averaging measures taken from each position, the true-portfolio backtester enters and exits positions like you would do in the real world. Real-life constraints such as cash, number of positions and other measures are taken into account, which means that if the portfolio has no cash left then no positions will be bought and if there are 50 positions to buy on a specific day and you are allowing only 3 then only 3 positions will be bought. Given these differences, backtester results may be very different from the rules analyzer results. If you want to use the true portfolio backtester to analyze each trading rule, you can create a new trading system, use the following formula then optimize the strategy. nb = ApplyRule("", "Patterns", -1); Optimize("a", 0, nb-1, 1); buy = ApplyRule("", "Patterns", a); SetSimTiming(_Sell, _Close, -1); SetSimStop(_StopNBar, _Point, 1, 0); More info about backtesting and optimization can be found here: True portfolio simulation applied to trading systems Optimization of a trading system
|

|
|
|
|


