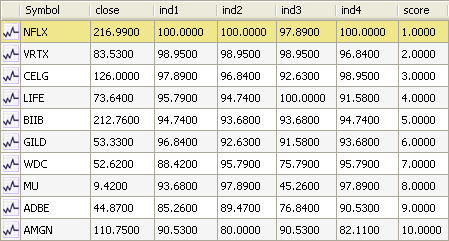
This article is the first part of a series where I will show you how to create a technical stock rating/ranking system and how to optimize it. For now, let us just concentrate on creating the technical stock rating system. You will see how easy it is to create rating systems in QuantShare. All it need is just few lines of code. You may want to start by reading this basic tutorial on the QuantShare programming language. Introduction A stock rating system simply analyzes several indicators for a given universe. It gives a rate or rank to each stock and for each indicator then calculates the overall score for each stock. The stocks that have the best rating are bought then sold if their rating drops below a certain threshold. In this example, we are going to create a rating system given the following indicators: - Percent above or below 200-bar simple moving average - 100-bar rate of change - 14-bar relative strength index - 100-bar Sharpe ratio of close series A weight is also applied to each indicator. We will see that later. Implementing the Stock Rating System First, let us see how each trading indicator can be implemented in QuantShare: - Percent above or below 200-bar simple moving average r1 = close / sma(200); - 100-bar rate of change r2 = roc(100); - 14-bar relative strength index r3 = rsi(14); - 100-bar Sharpe ratio of close series r4 = sharpe(close, 100); Now that we have the formulas, let us rank our stocks for each indicator. This can be done using the composite function (comp). rank1 = comp(r1, "percentile"); rank2 = comp(r2, "percentile"); rank3 = comp(r3, "percentile"); rank4 = comp(r4, "percentile"); As an example, the stock that has the highest (100-bar rate of change) will get a percentile value of 100 and the stock that has the lowest value will get a percentile value of 0. The last step consists of applying the global score formula for each stock and here is how: score = rank1 * 0.3 + rank2 * 0.3 + rank3 * 0.15 + rank4 * 0.25; score = comp(score, "rank"); In the first line, we assign a weight to each ranking formula then we calculate the global score. In the second line, we rank stocks based on that score and this time we use the "rank" parameter instead of the "percentile" parameter. This time, the stock that have the highest score value will get a rank value of 1, the second one will get a rank value of 2 and so on...  Stock rating data displayed using the screener tool. Create a Trading System Based on this Rating System If you never created a trading system before, please take a look at this how-to lesson first: How to create a trading system Creating a trading strategy based on our rating system is very simple. All you have to do is: - Create a new trading system, click on "Strategy" then on "Create trading system using the formula editor" - Copy the formulas we have created previously: r1 = close / sma(200); r2 = roc(100); r3 = rsi(14); r4 = sharpe(close, 100); rank1 = comp(r1, "percentile"); rank2 = comp(r2, "percentile"); rank3 = comp(r3, "percentile"); rank4 = comp(r4, "percentile"); score = rank1 * 0.3 + rank2 * 0.3 + rank3 * 0.15 + rank4 * 0.25; score = comp(score, "rank"); - Add the buy rule (Buy the top 5 stocks) buy = score <= 5; - Add the sell rule (Sell the stock if its rank goes above 10) sell = score > 10; In the next post of this series, I will show you how to: - Optimize weights - Optimize indicator settings - Optimize different list of indicators - Optimize your trading system
|

|
|
|
|


