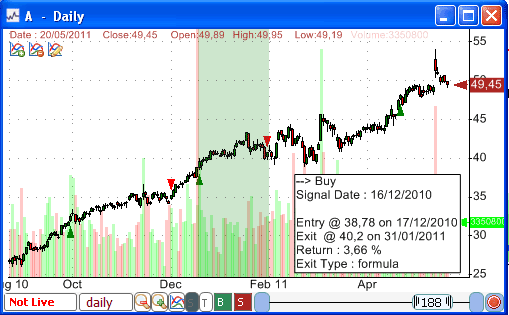
The idea behind this post is to allow you to quickly backtest a strategy using chart's data. Let us say, you are displaying Google chart with some indicators and you want to know what would be the performance of a system that uses one of these indicators. What we want to do here is create a script that just by clicking on it, would get chart's symbol, time frame and formula and use that to backtest a new strategy. Now, let me show you how easy it is to do such thing. Getting Chart Details First, let us create a new script. - Select "Tools -> Script Editor" - Select "File -> New" to create a new script - Type a name then click on "OK" Once done, get the script code from here and paste it in the formula editor (CONTROL+V shortcut) - Add the script to the bookmark panel for easy access (Settings -> Add Current Script to Bookmark Panel) What is the Bookmark Panel? Here is a brief description of what the script does: - Get selected chart - Get symbol, time frame and whether the chart is in EOD or Intraday mode - Loop through each pane and each formula and get the last formula that contains either the variable "buy" or "short" For more information on how to create trading system, please check this post: The Ultimate Guide to Create Trading Systems in QuantShare - Create a new trading system (You may update the first variable "tradingSystemName" in this script to set the trading system name) - Updates the trading system with the chart symbol, formula... - Backtest the trading system and display the backtesting report Backtest a Trading System from your Chart Here is an example on how to use this script: - Create a new chart - Create a new pane by right clicking on the chart then selecting "Create new pane" - Right click on the new pane then select "Edit Formula" - Add the Williams' %R indicator as well as two lines (-20 and -80 thresholds) a = Willr(14); Plot(a, "Willr", colorBlack, chartLine, StyleSymbolNone); plot(-20, ""); plot(-80, ""); - Click on "Update Graph" to display the indicator Let us say you notice that when Willr crosses above -20 line, the stock increases and you want to test this. - Add your buy and sell rules then click on "Update Graph" to save the formula buy = cross(a, -20); // Buy when Willr crosses above -20 sell = cross(-20, a); // Sell when Willr crosses below -20 - Backtest your trading system by double clicking on the script button (which should be located in the bookmark panel) - After few seconds, you get your trading system's backtesting report. Optimize your Trading System Besides doing simple backtests, you can also optimize a trading system right from your chart. In order to enable optimization, just use the "Optimize" function. Here is how it works: Instead of typing the following rules in your formula: buy = cross(a, -20); sell = cross(-20, a); Type: Optimize("v1", -50, -10, 10); buy = cross(v1, -20); sell = cross(-20, v1); Execute the script and you should get your optimization report ready in few seconds. 
|

|
|
|
|


