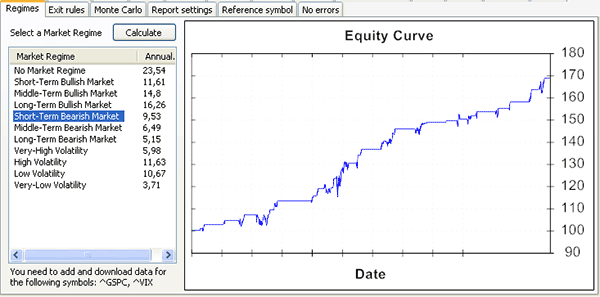
Say you have a trading system and you want to test it under different market conditions (market bullish/bearish or high/low volatility). Recently, we make it easy to test a trading system under such market conditions by implementing a new feature called "Market Regimes". - First, let us open the "Simulator" manager by selecting "Analysis -> Simulator". - Select a trading system then click on "Backtest". - In the simulation report, click on the "Regimes" tab - Click on "Calculate" to test the simulation under different market regimes. The "Annual Return" column will display the annualized return for the strategy if it was traded only during that market regime. - Now, click on any "Market Regime" to display the equity curve. That equity curve is calculated by talking the current strategy and removing all trades that were entered outside the selected market regime. After that the equity is rebuilt without these trades. This new tool allows you to quickly see how your trading system would have performed in the past under different market regimes.  How to create a new trading system with the selected Market regime When you click on any market regime, you can see a tooltip appearing. The tooltip gives you a description of the market regime, as well as its formula and the ticker symbol used for the calculation. If you click on "Short-Term Bullish Market" for example, you can see: ^GSPC price (S&P 500) is higher than its 50-bar moving average Symbol: ^GSPC Formula: filter = close > sma(50); In order to create a new trading system that trades only during the short-term bullish market, you will have to update your original trading system formula. Say the original formula for your trading system is: buy = rsi(14) > 70; The new formula that trades only the bullish market regime would be: sp = getseries("^GSPC", close); // ^GSPC is the S&P500 index - Yahoo compatible ticker name filter = sp > sma(sp, 50); buy = rsi(14) > 70 and filter; Explanation: The trading system formula is applied to every security referenced by your strategy ("Symbols & Dates" tab). We need to get the S&P 500 times series first. This can be accomplished using the "GetSeries" function. After that, we need to detect the short-term bullish market regime and this can be done by comparing the S&P 500 price with its 50-bar moving average. Notice how we used the "sp" variable in the "sma" function (Simple moving average). At the end we just need to add the market regime filter rule to the original buy rule (The one used by the original trading system). Market Regimes is a new feature and we plan to improve it over time. We will also add more market conditions and the ability to define custom market conditions.
|

|
|
|
|


