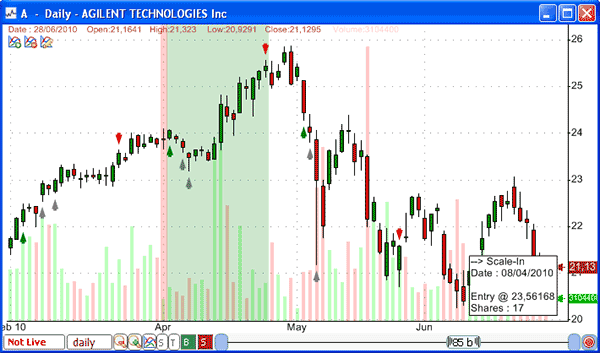
One of the main new features of the new 3.4.1 version of QuantShare is the new Quote Sheet tool for the real time version. Below a brief description of some of the different features we have added to this new version. Quote Sheet Tool You can create a new quote sheet by selecting "Tools -> Quote Sheet". We have created this tool to make it easy to display real time data from your data provider. All you have to do is type the security ticker name under the "Symbol" columns. Note that if you expand the quote sheet control, more columns will be added. By right clicking on the quote sheet you would be able to do many things such as enabling sorting (click on a column header to start the auto-sorting feature), inserting a divider, changing the row color... and updating the displayed columns. To display more columns in your quote sheet, right click on the quote sheet then select "Settings". In the "Column" tab, you can add for example a column to display the day's high, day's low, bid, ask, sector, industry... Note that some fields such as the OptionCallOpenInt, Lastyield, TradeCount... are available only when Interactive Brokers is selected as data feed. One more important thing to know is that each quote sheet should be associated with a data provider. You can have different quote sheets where each one displays data from a different data provider. To update the data provider associated with a quote sheet, select the "Settings" column in the "Settings" control we opened previously. Next to "Data Feed", select your data provider. Only connected data providers are displayed there. Trading System Report If you still don't know how to create and backtest a trading system, we highly recommend you begin by reading this blog post: The Ultimate Guide to Create Trading Systems in QuantShare In the trading system report that appears once a backtest is completed, select "Report Settings" tab then click on "Generate HTML Report". This will generate and display an html report for your trading system. In case you want to update the report look, open your QuantShare folder (it is usually c:\program files\ctrading\quantshare) and edit the "tstemplate.html" file. The QuantShare report tool uses that file as a template to create the html report. All it does is update the different tags with the appropriate system result information. As an example, it replaces the following tag ({{EquityChart}}) with the equity chart Scale in-out Signals on Charts You probably know how to display your trading system's signals (buy, sell, short and cover signals) on a chart but in case you don't, all you have to do is click on the "Plot Entries & Exists on chart" check box in the trading system report form. In this new version, the scale-in and scale-out entries and exits will be displayed as well on your chart (Gray arrows). Of course you will be able to click on these arrows to display the number of shares bought or sold as well as the entry/exit price.  Recent Orders To open the "Recent Orders" control, select "Portfolio" then "Recent Orders". The control will display all the recent orders you have taken manually or automatically using your automated trading systems, charts or entry orders forms. Note that this control is available only in the real time version.
|

|
|
|
|


