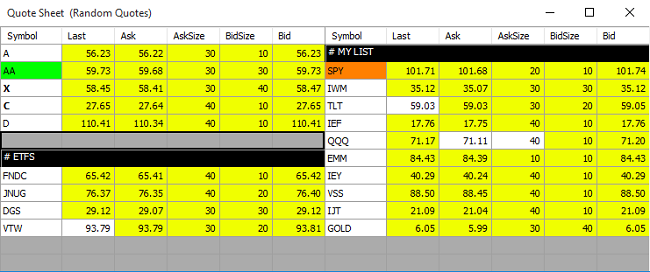
Unlike the Grid tool that can be used to create advanced real-time tables (such as a real-time correlation matrix), the Quote sheet is a very easy to use tool that displays real time data for the securities you want to track. As with the Grid tool, the Quote sheet tool is available only in the real-time premium version of QuantShare. Open a new quote sheet by selecting "Tools" from the menu then "Quote Sheet". This will create an empty quote sheet. All you have to do now is type the ticker symbol under the "Symbol" column to display the last, net, ask, bid... data in real time for that security. The default data provider will be used to retrieve real time data. Click here for the list of data providers we currently support. In the top of that list, we also support Bloomberg, Stockwatch and any data feed that supports Excel DDE or RTD technologies. To change the default data provider, right click on the quote sheet, select "Settings", click on "Settings" tab then change the "Data Feed" field. If you have multiple data feeds, you can open different quote sheets and each one could use a different feed. Unlike the grid tool where each cell can have its own data feed, all cells in a single quote sheet must be associated to only one data feed. Quote Sheet Settings Right click on the quote sheet then select "Settings" to open the settings control. Columns Tab: Here you can define the fields you want to add to your quote sheet. To do so, simply select a field then click on the "+" button at the top. You can organize the added fields by clicking on the up and down arrows. Please note that some fields are available for a particular data feed while other not. For example, the Implied volatility, VWAP, Option call open interest, last yield... fields are available only when using Interactive Brokers as data feed. Settings Tab: In the "Settings" tab, you can define the quote sheet title, data feed, background color, price change color, font color, text size and divider color. If you want to specify default settings for any new quote sheet you plan to open in future, just define your settings then click on the "Save As Default" at the bottom of the quote sheet settings control.  Quote Sheet Layout If you have selected to display 5 columns in your quote sheet, then these columns will be repeated if you increase the quote sheet form width. This will allow you to have two, three or more "Symbol" columns and thus the ability to display more data horizontally. Also it is important to note that the quote sheets can be docked in the main QuantShare form. All you have to do is keep pressing on the ALT key and start moving the quote sheet form. You will then see several points where you can dock the form. Import & Export Data To export quote sheet data to CSV format for use with Excel or any other program, right click on the quote sheet then select "Export Data". If you want to follow multiple ticker symbols and don't want to enter them manually in the quote sheet, copy all these symbols in a text file (one symbol per line) then right click on the quote sheet and select "Import/.... Symbols". You can also drag and drop symbols from one quote sheet to another to copy them. Hold the CONTROL key then drag and drop to copy a symbol within the same quote sheet. Sorting Data In the quote sheet, you have the ability to sort the data by any column by first enabling the sorting feature (Right click then click on "Enable Sorting"). Once done, click on any column to start sorting the data. The data is sorted in real time. This means that if you sort the data by the ask price, the security with the highest ask price will always be displayed first/last. Also note that each time you add an empty line or a divider, a new group of stocks is created. Each group of stocks is sorted separately.
|

|
|
|
|


