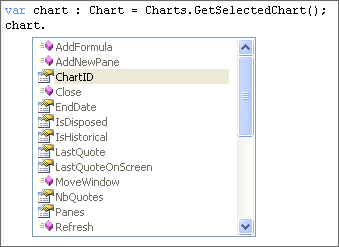
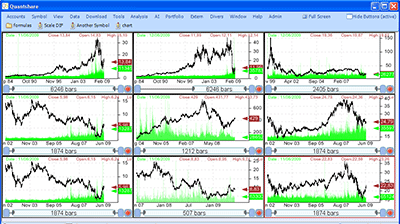
Chart class The Chart object is created using the .Net Script; it contains the chart settings and allows you to perform some actions on the pointed chart. A chart class could be created using the following function Charts.GetSelectedChart(); it orders the application to get a chart object of the currently selected chart. Open the script editor 'Tools->Script editor' and type the following code to see what variables and functions the chart class exposes: var chart : Chart = Charts.GetSelectedChart(); chart.  As you can see, you can add a new formula, add a new pane, get the number of quotes, move the chart window, change the symbol name, get the visible start or end dates… Historical Quotes Charts Now let us create a script that opens 9 charts to display the historical quotes of some symbols. Here is the code: var nbcharts : int = 9; var currentnbcharts : int = Charts.NbCharts; if(currentnbcharts < (nbcharts)) { for(var i: int = 0;i<(nbcharts - currentnbcharts);i++) { // Get the default chart formula and symbol var chart : Chart = Charts.OpenChart(null, null, null); chart.ScrollBarNbQuotes = 10000; } } // Arrange charts Charts.Arrange(); You can change the 'nbcharts' (number of charts) variable to specify exactly how many charts you want to be displayed in the screen. The 'chart.ScrollBarNbQuotes' variable gets a value of 10000, which means that our charts will display historical quotes of 10000 bars, if enough data is available. Each chart will show historical quotes that go back to 2002. To make the charts look better, you can remove the title bar from each one. To do so, click on View', then select 'All windows style', and finally click on 'Without caption'. This will remove the caption of all visible charts. You can make the removal of caption permanent for new charts by selecting 'View->Window Style->without caption'.  Note also that you can specify the number of columns and rows in the last function (Charts.Arrange) and thus you can arrange charts in different ways.
|

|
|
|
|


