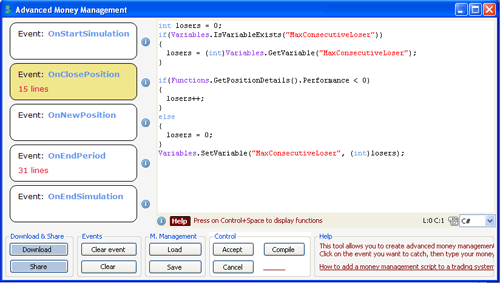
Using the money management tool, you can dynamically calculate metrics and then take trading decisions based on these metrics. For example, you can calculate the number of consecutive losing trades for each trading day using the following script in the "OnClosePosition" event: int losers = 0; if(Variables.IsVariableExists("MaxConsecutiveLoser")) { losers = (int)Variables.GetVariable("MaxConsecutiveLoser"); } if(Functions.GetPositionDetails().Performance < 0) { losers++; } else { losers = 0; } Variables.SetVariable("MaxConsecutiveLoser", (int)losers); In the "OnEndPeriod" event, you can then get the value of the "MaxConsecutiveLoser" variable and stores it in an array using "Variables.SetVariable" function. To get an average value over N-days, use the following code: if(Variables.IsVariableExists("MaxConsecutiveLoser")) { int losers = (int)Variables.GetVariable("MaxConsecutiveLoser"); ArrayList losersArray = new ArrayList(); if(Variables.IsVariableExists("MaxConsecutiveLoserArray")) { losersArray = (ArrayList)Variables.GetVariable("MaxConsecutiveLoserArray"); } losersArray.Add((double)losers); double sum = Sum(losersArray, 10); double average = sum / 10; Variables.SetVariable("MaxConsecutiveLoserArray", losersArray); Divers.Output(losers + "\n" + " - Array Count: " + losersArray.Count + " - Sum: " + sum + " - Avg: " + average); // Output visible in Trading System Report -> Details tab } #functions# double Sum(ArrayList list, int bars) { double sum = 0; int start = Math.Max(0, list.Count - bars); for(int i=start;i < list.Count;i++) { sum = sum + (double)list[i]; } return sum; } The time-series, which is stored in an Array, is passed to the "Sum" function to calculate its sum over N-bars. The result is then divided by "N" to get an average value. 
|

|
|
|
|